
Richmond Housing Market Update — Spring 2026: Why More Buyers Are Choosing to Build Custom
If you've been house hunting in the Richmond metro area recently, you already know the story: there's not enough inventory, prices keep climbing, and the homes that do hit the market often need $30K–$50K in updates before they feel like "yours." It's frustrating — and it's not getting better anytime soon.
But here's what we're seeing at Keel Custom Homes: more buyers than ever are stepping out of the resale market entirely and choosing to build instead. And when you look at the numbers, it makes a lot of sense. Mortgage rates just dropped below 6% for the first time in three and a half years, construction material costs have stabilized, and Richmond's fastest-growing counties happen to be exactly where custom homes get built.
Let's break it all down.
The Big Picture: Richmond's Market Is Still Tight
Richmond's housing market ended 2025 strong and entered 2026 with the same fundamental challenge it's had for years — there simply aren't enough homes for the number of people who want to buy them.
The headline numbers (Richmond metro, through January 2026):
Median sale price: $434,925 for single-family homes, up 2.3% year-over-year (RAR/CVRMLS Housing Supply Overview, January 2026)
Months of supply: just 1.2 months for single-family homes - down 14% from a year ago and far below the 4–6 months that define a balanced market (RAR/CVRMLS Q4 2025 Quarterly Indicators)
Median days on market: 25 days for the full year; 29 days in Q4 (RAR/CVRMLS Q4 2025)
Sale-to-list ratio: 100% - on average, homes sold for exactly their asking price in 2025 (RAR/CVRMLS)
To put the inventory number in perspective: if no new homes were listed tomorrow, everything on the market would sell in about five weeks. That's how thin the selection is.
And it's not just a local phenomenon. Richmond BizSense reported that five key Richmond-area counties face an annualized housing deficit of nearly 11,000 units — meaning we're not building or rezoning anywhere close to enough to keep up with demand (Richmond BizSense, July 2025). Nationally, the shortage is estimated at 3.8–4.7 million homes (NAHB).
Richmond Association of REALTORS® CEO Laura Lafayette summed it up well: the median home price in the Richmond metro has increased roughly 50% in the last four years, and the income needed to afford that median-priced home has nearly doubled (VPM News, June 2025).
Meanwhile, the national spotlight is on Richmond. Realtor.com ranked us a top-10 housing market for 2026, forecasting 6.9% price growth and a 3.6% increase in sales — well above the national average (Axios Richmond, January 2026). That's great for homeowners, but it means buyers waiting on the sidelines will likely face higher prices later this year.
The Problem with Resale: Richmond's Housing Stock Is Old
Here's a stat that surprises a lot of people: the typical home in the Richmond metro area was built in 1993. In the city of Richmond proper, it was 1959. Roughly 70% of all homes in the metro are more than 20 years old, and only about 1.6% were built in 2020 or later (U.S. Census ACS via Point2Homes).
What does that mean in practical terms? It means most of the homes you're competing for on the resale market come with aging HVAC systems, outdated electrical panels, original roofing that's nearing end-of-life, and floor plans designed for a different era. That "move-in ready" home you're eyeing may need a new roof in three years and an HVAC replacement in five — easily $20,000–$50,000 in costs that don't show up in the listing price.
When you build new, everything is current — insulation, windows, mechanical systems, building codes, energy efficiency. You won't face a surprise repair bill for a decade or more.
Where the Growth Is: County-by-County Snapshot
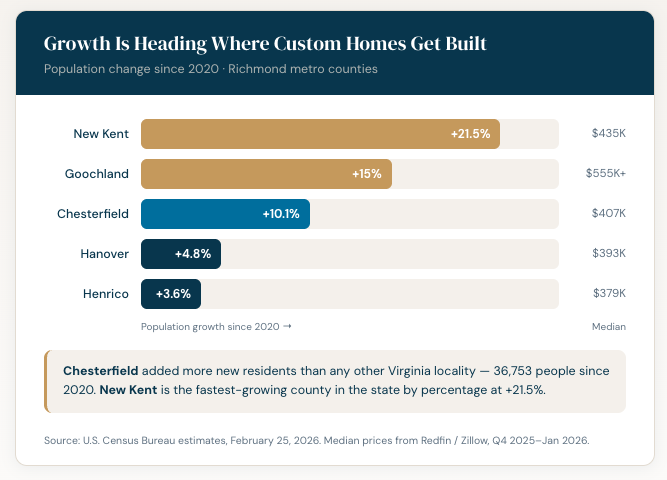
One of the most striking findings in the data is where Richmond is growing fastest. Brand-new Census Bureau estimates released just this week (February 25, 2026) show a dramatic population shift away from Northern Virginia and toward the Richmond metro's outer counties — exactly where custom homes get built (Cardinal News / Census Bureau, Feb 25, 2026).
Here's where things stand across the counties we build in:
Chesterfield County is adding residents faster than any other locality in Virginia — 36,753 new people since 2020 (a 10.1% increase), surpassing even Loudoun County. The median sale price sits at roughly $407,000 with homes moving in about 36 days. Chesterfield's combination of strong schools, growing infrastructure, and communities like Summer Lake make it one of our most active building areas. (Redfin Chesterfield County; Cardinal News)
Henrico County remains the metro's most established suburban market, with a median around $379,000 and Zillow values near $402,000. The Short Pump corridor and River Road area continue to attract buyers, and homes are selling at about $226 per square foot — up nearly 5% year-over-year. (Redfin Henrico County)
Hanover County is the steady performer of the group — a mature market where the median sale price hovers around $393,000–$426,000 and homes move in just 28 days. It's particularly attractive for families drawn to its schools and semi-rural character. (Redfin Hanover County)
Goochland County is the premium custom home market. Median sale prices range from $555,000 to $638,000 (it fluctuates with small sample sizes), and the county grew 15% since 2020. With large available lots — the median listing on Land.com is 53 acres at about $13,700 per acre — and a low 0.5% effective property tax rate, Goochland remains the go-to for buyers wanting land, privacy, and James River access. (Redfin Goochland County; Land.com Goochland)
New Kent County is the headline story — it's now the fastest-growing county in all of Virginia, with population up 21.5% since 2020. The median sale price is about $435,000, and at $221 per square foot (up nearly 10% year-over-year), values are appreciating quickly. For buyers looking for more affordable land between Richmond and Williamsburg, New Kent is increasingly on the radar. (Redfin New Kent County)
Powhatan County rounds out the picture with a rural feel and growing custom home activity. The median recently hit $591,000, though that number can swing significantly due to low volume. Land is available and builders are active. (Redfin Powhatan County)
Mortgage Rates: Below 6% for the First Time Since 2022
This is the part of the update that might matter most for your decision.
The 30-year fixed mortgage rate dropped to 5.98% for the week ending February 26, 2026 — the first sub-6% reading in three and a half years. That's down from a peak of 7.04% in January 2025, a decline of more than a full percentage point. (Freddie Mac PMMS)
Freddie Mac's chief economist Sam Khater noted that the lower rate environment is improving affordability and driving more potential buyers into the market for spring homebuying season. Purchase application activity is running more than 20% higher than a year ago, and refinance applications have more than doubled year-over-year. Buyers are taking notice.
Looking ahead, the consensus among 21 industry forecasters surveyed by ResiClub is that rates will average around 6.18% for full-year 2026 — with some estimates dipping into the mid-5% range by year-end. The Federal Reserve cut rates three times in 2025 and is expected to continue easing, though gradually. (Fast Company / ResiClub)
What this means for custom home buyers specifically: Construction-to-permanent (CTP) loans — the most common way to finance a custom build — let you lock in your rate at the outset. That means you can secure today's favorable rates before your home is even framed. These loans now account for about 77% of all custom home financing, up from 69% in 2020. The permanent phase typically runs in the high-6% to low-7% range, with interest-only payments during construction. (Amerisave)
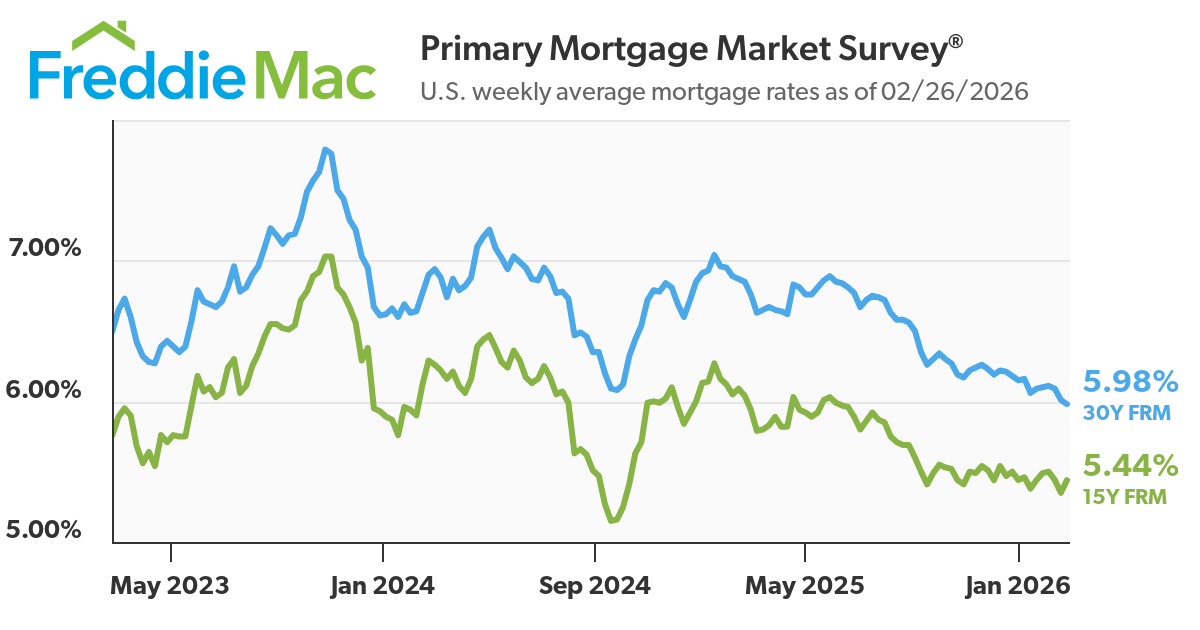
Mortgage rates dip under 6% for the first time since 2022
Construction Costs: Stabilized and Predictable
If you've been putting off building because of the wild material cost swings of 2021–2022, here's some reassuring news: those days are behind us — at least for now.
Lumber is the biggest single material input for a new home, and prices have settled dramatically. Current futures are trading around $590–600 per thousand board feet — that's roughly 60–65% below the May 2021 peak of $1,711. Prices are essentially flat year-over-year and well within a manageable, predictable range. (Trading Economics)
Overall construction material costs rose just 2.8% nationally in 2025 according to Gordian/ULI data. When you adjust for inflation, that's essentially flat. Christopher Thornberg of Beacon Economics put it plainly: material costs have been more or less flat over the course of the last year. (ULI/Gordian Construction Costs Outlook 2026)
What does a custom home cost to build in the Richmond area? For house-only construction (excluding land), you're typically looking at:
$175–$200/sq ft for entry-level custom with standard finishes
$200–$250/sq ft for mid-range custom — the sweet spot for most of our builds
$300+/sq ft for high-end luxury with premium finishes and specialty spaces
These numbers have been relatively stable over the past 12–18 months, and our contracts lock in pricing so there are no surprises during your build.
One important caveat about waiting: while materials have stabilized, labor costs continue to climb — construction wages are rising 6–8% annually, and the industry faces a shortage of nearly 500,000 skilled workers nationally (NAHB/HBI Construction Labor Market Report). There's also ongoing tariff risk on Canadian softwood lumber and reduced mill capacity. The cost trajectory from here is more likely up than down, making 2026 a smart time to lock in a build.
The National Picture: Custom Building Is Growing
It's not just us seeing more interest in custom. Nationally, custom home building is gaining market share.
According to NAHB data, custom home starts reached 51,000 in Q3 2025 — up 6% year-over-year — and now represent about 19% of all single-family starts, the highest share since 2022. Over the trailing four quarters, 187,000 custom homes were started nationwide, up 5% from the prior period. (NAHB Eye on Housing, January 2026)
NAHB Chief Economist Robert Dietz explained the dynamic: the custom building market is less sensitive to interest rate cycles and more responsive to household wealth. With spec building activity down and equity markets performing well, more buyers have the financial position and motivation to build exactly what they want rather than settle for what's available.
Here's another data point that might surprise you: nationally, new homes now cost less than existing homes. In Q2 2025, the new home median was $410,800 while the existing home median was $429,400. That's a historic reversal — for years, new construction carried a significant premium. (Amerisave / Census / NAR)
In the Richmond metro, new construction does still carry a premium (reflecting larger homes in suburban locations), but when you factor in the hidden costs of buying older — deferred maintenance, system replacements, energy inefficiency, and renovation to get what you actually want — the gap narrows quickly.
Why 2026 Is a Strong Year to Build Custom in Richmond
We try to be straightforward in these updates rather than just cheerleading, so here's our honest read: the data points are aligning in ways that favor custom home buyers right now more than they have in several years.
Rates are down. At 5.98%, you've just crossed below 6% for the first time since September 2022 — and you can lock that in with a construction-to-permanent loan before your home is even built.
Material costs are stable. Lumber is 60–65% off its pandemic highs. Overall construction costs are rising at the pace of inflation. This is a window of relative predictability.
Inventory is still scarce. With just 1.2 months of single-family supply, finding your ideal home on the resale market is like finding a needle in a haystack — and then winning a bidding war to get it. Building custom is the only way to guarantee you get what you want.
Richmond's housing stock is aging. The typical metro home is 32 years old. The typical city home is 66 years old. If you want a modern floor plan, energy-efficient systems, and a home built to current codes, your options on the resale market are extremely limited.
Growth is heading your way. The counties where custom homes get built — Chesterfield, Goochland, New Kent, Hanover — are among the fastest growing in Virginia. That means your investment is backed by strong, sustained demand.
Richmond's economy is booming. Job growth at 2x the national average, major employers like CoStar, Lego, and the Diamond District development, and a cost of living 10% below national averages all point to continued housing demand.
None of this means building is right for everyone — it's a significant commitment and investment. But for buyers who've been on the fence, frustrated by what's available, or waiting for the "right time," the 2026 market conditions make a strong case.
Ready to Explore Building Custom?
At Keel Custom Homes, we build custom and semi-custom homes throughout the Richmond metro — from Chesterfield and Henrico to Goochland, Hanover, New Kent, and Powhatan. Our builds typically range from $175 to $300+ per square foot depending on your finishes and floor plan, and we handle everything from lot evaluation to design, permitting, and construction.
If you've been thinking about building, we'd love to walk you through what it looks like — the timeline, the costs, and the process. No pressure, just an honest conversation about whether custom makes sense for you.
Sources for this article include the Richmond Association of REALTORS® / Central Virginia Regional MLS, Virginia REALTORS®, Redfin, Freddie Mac, NAHB, U.S. Census Bureau, FHFA, Trading Economics, ULI/Gordian, Axios Richmond, VPM News, Richmond BizSense, and Cardinal News. All data reflects the most recent reports available as of February 2026. Links to individual sources are included throughout the article.